
Vol. 1, No. 8, Published December 9, 2015
Guest Column: California�s Poor Have Tech, Rich Have More
By Allison Hata, David Prince, and Paul Thomas

People care about the distribution of income and wealth, and these concerns lead to an evaluation of each revolution in information technology to see whether it helps the poor catch up with the rest of society, or whether it exacerbates the income and wealth divide. In The Oxford Handbook of Internet Studies (2013), Eszter Hargittai and Yuli Patrick Hsieh lay out three related questions on the topic: 1) Is digital technology too expensive for the poor to access? 2) Do the wealthy use it in a systematically different way than the middle class and poor? and 3) Does the use of the technology affect the distribution of income, increasing or decreasing the income gap?
Income clearly is a determinant of technology ownership, but even low-income Californians have at least some of the basic tools needed to participate in our high-tech economy, according to a monthly survey of U.S. and Chinese households conducted by Intel that investigates ownership and purchases of devices including desktop computers, notebooks, tablets, and smartphones. The table below shows that the number of devices in a home does indeed increase with income, but even those at the lowest income category we measure have substantial levels of ownership; 84 percent of households earning less than $22,500 per year have at least one PC, tablet, or smartphone, and on average those low-income households have two such items (See Figure 18).
Figure 18: Number of Devices in Home Increases With Income
| California | PC+Tablet+Smartphone | ||||
|---|---|---|---|---|---|
| Annual Household Income | % of Households | Average Household Size | Household Penetration | Number of Devices* | Number of Devices per Capita* |
| Less than $22,500 | 15% | 1.7 | 84% | 2.10 | 1.27 |
| $22,500-$49,999 | 22% | 2.8 | 91% | 3.84 | 1.36 |
| $50,000-$74,999 | 14% | 2.4 | 99% | 4.10 | 1.73 |
| $75,000-$99,999 | 11% | 2.9 | 98% | 5.29 | 1.82 |
| $100,000 or above | 38% | 2.9 | 100% | 6.32 | 2.16 |
Survey data aggregated from April-September 2015, 501 California households.
* Average number of devices for all households, including those with none.
Looking at the bigger picture, the 84 percent device penetration within the lowest-income California households is similar to the 82 percent result for those at that same income level nationwide. It is somewhat harder, however, to compare the California results to those of China. Despite China�s remarkable economic success, incomes in China are still much lower than those domestically. Indeed, for years we have watched as businesses and consumers in China have purchased more PCs than might be expected given the size of the Chinese economy, as the country has moved rapidly to increase its productivity and its concomitant level of information technology.
Figure 19: Devices in Chinese Homes
| China | PC+Tablet+Smartphone | ||||
|---|---|---|---|---|---|
| Annual Household Income | % of Households | Average Household Size | Household Penetration | Number of Devices* | Number of Devices per Capita* |
| Less than $2,811 | 18% | 3.1 | 60% | 1.41 | 0.45 |
| $2,812-$5,625 | 22% | 3.5 | 87% | 2.45 | 0.71 |
| $5,626-$7,500 | 20% | 3.5 | 95% | 3.05 | 0.87 |
| $7,501-$9,376 | 14% | 3.4 | 97% | 3.63 | 1.05 |
| $9,377 or above | 27% | 3.6 | 99% | 4.11 | 1.14 |
| Total PRC | 100% | 3.5 | 88% | 2.99 | 0.87 |
Survey data aggregated from April-September 2015, 7,680 China households.
* Average number of devices for all households, including those with none.
As compared to China, the lowest 15 percent of California households by income have greater access to technology � again, 84 percent have at least one device, about 1.3 per person � than the closest category we have for China, where the lowest 18 percent of households have about 60 percent ownership and only 0.45 devices per person. In fact, the poorest Californians fare similarly to the overall Chinese population in device ownership, and better as measured in devices per capita.
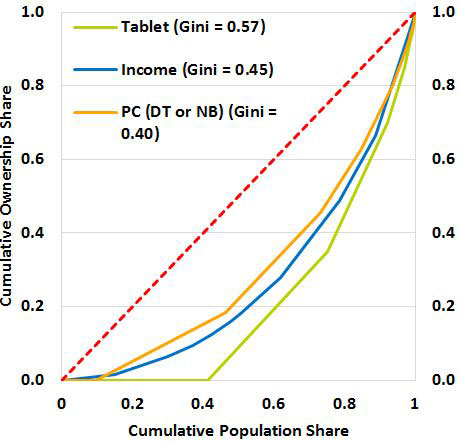
Just how unequal is the ownership of technology? The best known measure of income inequality is probably the Gini coefficient, a geometric concept based on a graph called the Lorenz curve. We have borrowed this same concept to look at the concentration of technology. We created Lorenz curves by lining households up from those with the fewest devices to those with the most and, for each level, graphing the proportion of the population that has that amount or lower. Below are some Lorenz curves for technologies from our consumer survey for California, and plotted along with them is the traditional curve for income (See Figures 20 and 21).
Figure 20: California Lorenz Curves
Conclusions and Policy Implications
Figure 21: California Gini Coefficient
| Gini Coefficient | |
|---|---|
| Phablet (SP 5”+) | 0.78 |
| Tablet | 0.57 |
| Desktop | 0.57 |
| Sub-5” Smartphone | 0.53 |
| Notebook | 0.48 |
| Annual Household Income | 0.45 |
| Smartphone | 0.43 |
| Desktop+Notebook | 0.40 |
| Desktop+Notebook+Tablet+Smartphone | 0.37 |
| Desktop+Notebook+Smartphone | 0.37 |
The dotted diagonal line represents the Lorenz curve for the population with a perfectly uniform distribution. The Gini coefficient, then, measures the portion of the area under the perfect equality dotted line that is missing from the actual Lorenz curve. The Gini coefficient runs from 0 to 1, with 0 for a perfectly equal distribution and 1 for a population in which all of a resource belongs to just one person.
Using the survey�s data for California households, the Gini coefficient for income is 0.45, about the same income inequality as the survey�s measure for the entire United States. The data further show that information technology is somewhat more evenly distributed across the state�s households than is income, with Lorenz curves for PC and smartphone ownership largely residing above that for income, and so having correspondingly lower Gini coefficients. Tablets are the exception, but when considering tablets together with the other technologies as an aggregate measure of technology ownership, that distribution still is more uniform than income.
We have helped to answer the first of the questions we posed at the beginning, that technology is not evenly distributed across California households and higher-income Californians do have greater access to PCs, tablets and smartphones. Nonetheless, the poorest California households do have considerable technology at their disposal. Still to be determined is how they use these technologies, and whether their use can help them improve their standing.
Allison Hata is a statistician, David Prince is a senior economist, and Paul Thomas is the chief economist for Intel Corporation. Thomas is also a member of Treasurer John Chiang’s Council of Economic Advisors. The opinions in this article are presented in the spirit of spurring discussion and reflect those of the authors and not necessarily Intel Corporation, the Treasurer, his office or the State of California.