Subscribe to Intersections 
VOL. 3, NO. 4
Published April 13, 2017
IN THIS EDITION:
State Treasurer’s Office Fights Climate Change on Many Fronts
Head to Head: Autonomous Vehicles


Job Tracker: California Retains Its Momentum
P3s and Transportation Infrastructure: Challenges and Opportunities

Job Tracker: California Retains Its Momentum
By Lynn Reaser, Ph.D., CBE
California’s job engine remained in gear in February with gains widespread across industries and regions. The state’s jobless rate fell to its lowest level in a decade. At 5.0%, it is just barely above the national 4.7% average.
Employers’ payrolls expanded by nearly 23,000 workers between January and February, the largest gain in three months. Compared with a year ago, nonfarm employment is up by about 316,000, led by education and health care, leisure and hospitality, and trade, transportation, and utilities. (See Figure 1.) Only mining and manufacturing are still below their year-ago levels, although the drop in manufacturing jobs is less than 1.0%.
California also reached another milestone, beating the nation in terms of year-over-year job growth for the 60th consecutive month or five complete years. Education and health care also led this performance with a year-over-year advance of 3.6%.
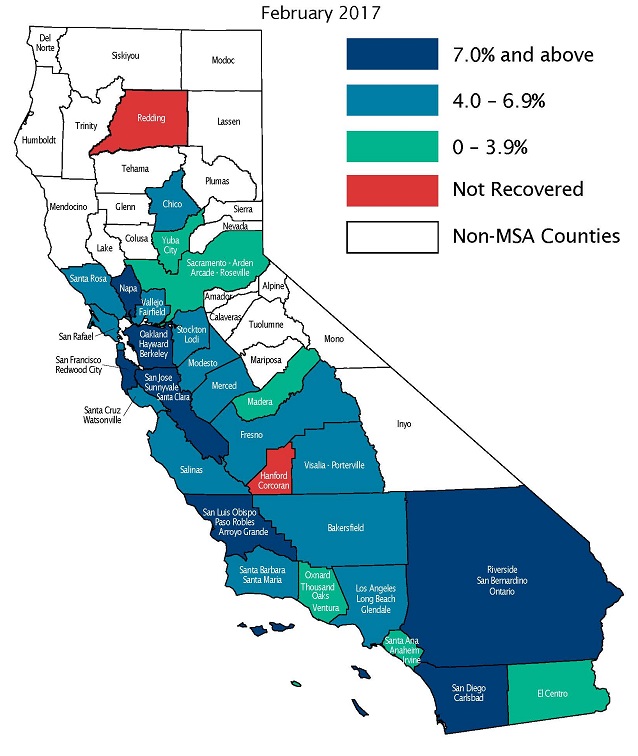
With respect to regional performance, 27 of the state’s 29 metropolitan areas have now fully recovered job losses incurred during the Great Recession of 2007-09. These areas represent 99.3% of the total, leaving only Redding and Hanford behind. (See Exhibit 2.) Redding could join the “recovery club” by midyear if it retains the job pace of recent months. It appears that the Hanford-Corcoran area will take much longer.
In addition to questions about the positive and negative effects on California of any changes in federal policies and laws, the performance of Silicon Valley and the Bay Area will bear close watching. A slowing in the tech boom or adverse effects of high home prices could slow what has been one of California’s primary growth leaders. While the San Francisco area bounced back with job gains in February after a loss in January, Santa Clara County has now lost jobs for two months in a row. Oakland has also seen its area’s payrolls drop during the past two months.
Employment in all 29 of California’s metropolitan areas is higher than a year ago, indicating that the state’s diverse set of economic drivers – ranging from tourism to aerospace – are serving it well.
Figure 1 - California Job Growth Embraces Most Sectors
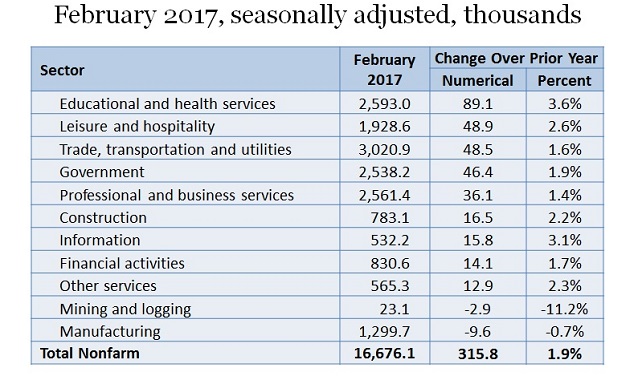
Figure 2 - Recovery Remains Widespread — Percent changes in jobs from pre-recession peaks
See raw data: Employment numbers by region.
Source: FBEI, EDD
Lynn Reaser is chair of the Treasurer’s Council of Economic Advisors and chief economist at the Fermanian Business and Economic Institute for Point Loma Nazarene University. The opinions in this article are presented in the spirit of spurring discussion and reflect those of the author and not necessarily the Treasurer, his office or the State of California.