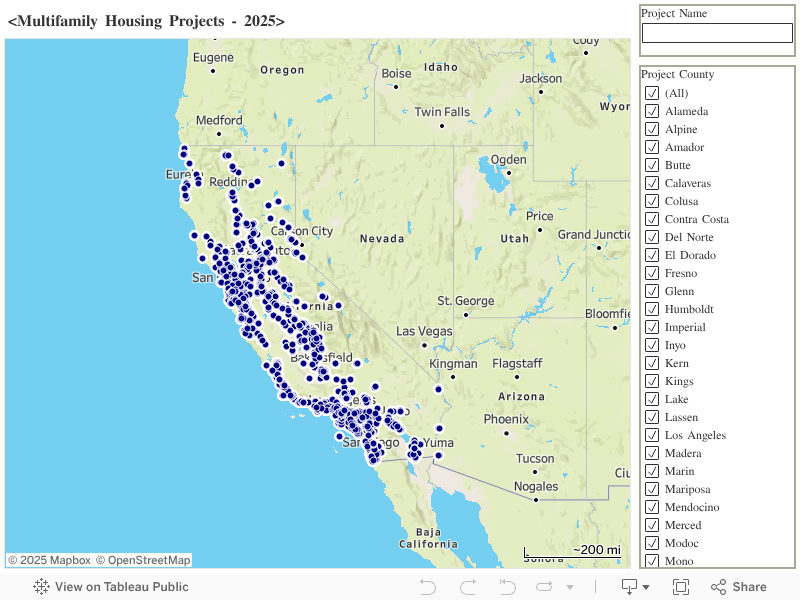


Project Mapping
The California Tax Credit Allocation Committee (CTCAC) has developed a map displaying the location of all existing multifamily housing projects developed using Low Income Housing Tax Credits (tax credits) in California. A dot on the map identifies each project location. To access more detailed information for a project, use the map’s navigation controls and your computer’s cursor or mouse. Using the computer mouse scroll wheel generally results in easier and more accurate navigation when zooming in for a street-level view of the map. If a project location (dot) is clicked, summary information will be displayed in a pop-up box (project ID and name, location, site phone number, housing and construction type, number of low income units, and developer name). The link below labeled "List of Projects" provides access to the project data in an Excel spreadsheet. The instruction sheet describes how project information is organized, and how to access useful spreadsheet functions.
A few project locations required unique displays due to data and visual limitations. Projects that were developed in phases with the same physical address are displayed as a single project with combined information. For example, a large housing project that was constructed in phases over a number of years will have the phases combined since the map dot identifies only a single location. In such cases, all phases’ total low income units are included. Projects with multiple physical addresses (scattered sites) are displayed differently since the CTCAC database does not record complete data for each separate location. Each “scattered site” is displayed at its physical address, but the total low income units for all scattered sites are displayed in each site’s pop-up summary. You may contact the project property manager or developer to determine the number of units at each site.
The project ID contains additional information about the project’s tax credit funding. The CTCAC ID or application numbers are formatted CA-YEAR-XXX. The YEAR identifies the year in which the tax credit award was made, and the -XXX identifies the type of tax credit funding. The 9% project numbering ranges from -001 to -299, the 4% project numbering ranges from 400 to -999, and projects funded with American Recovery and Reinvestment Act (ARRA) from 2009-2010 range from -500 to -699. All active projects receiving a tax credit award are shown on the map, through September 2025. Those awarded between 2020 and 2025 may not have completed construction or be available for tenant rental.
If you are a market analyst using the Excel spreadsheet for a market study, be aware that the list of projects is not current and cannot be relied on as the sole resource for affordable housing in a market area. To identify additional projects funded with low income housing tax credits since September 2025, refer to Meetings and Staff Reports.
How You Can Help CTCAC
Project information is presented from the CTCAC database and owner reported documentation. While efforts have been made to ensure the display of accurate information on the map and accompanying spreadsheet, some project data may contain errors. Project owners and developers are asked to contact CTCAC staff if inaccuracies are found so that corrections may be made. Please contact the Development Team via email to request corrections.