PMIA Resources

Program Description

Reporting Documents

PMIA Investment Policy

PMIA Statutes

Pooled Money Investment Board
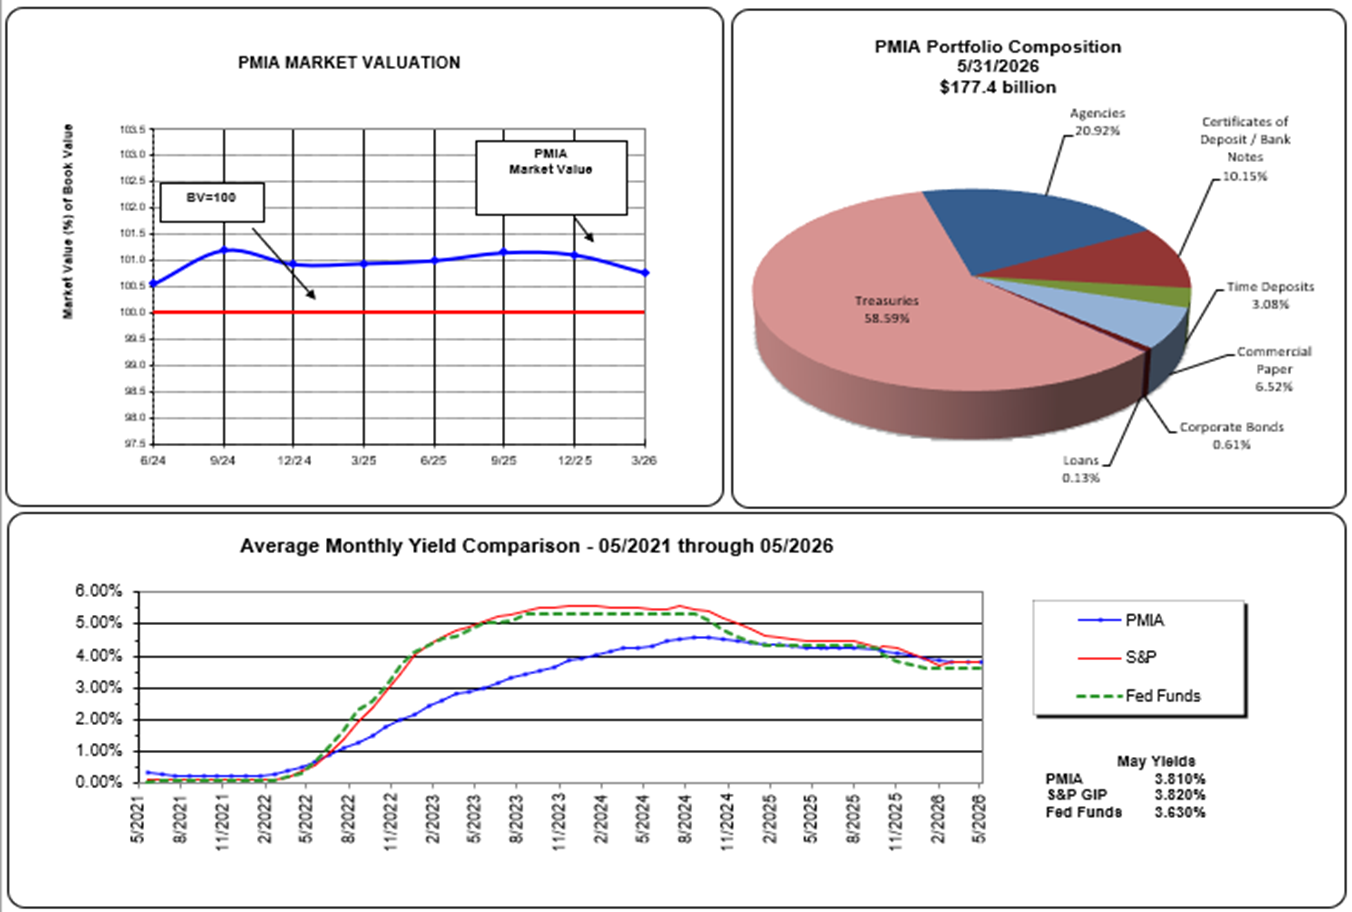
Fast Facts May 2026
| Ending Portfolio | $177.4 billion |
| Average Workday Investment Activity | $2.349 billion |
| Average Effective Yield | 3.810 percent |
| Average Investment Life | 271 days |
| Local Agency Investment Fund Ending Portfolio | $28.8 billion |
| Time Deposits Ending Portfolio | $5.5 billion, 155 deposits, 56 institutions |
Portfolio and Performance Overview
Documents and Reports
Additional Investment Programs

Local Agency Investment Fund
Time Deposit Program
Contact Information

Director Of Investments
(916) 653-3147
Assistant Director Of Investments
(916) 653-3147
PMIB Administrator
(916) 653-3147

Pooled Money Investment Account
915 Capitol Mall, Room 420
Sacramento, CA 95814
P.O. Box 942809
Sacramento, CA 94209-0001