Subscribe to Intersections 
VOL. 2, NO. 9
Published September 14, 2016
IN THIS EDITION:
New Programs to Improve Lives in California's Disability Community
Head to Head on Repealing the Death Penalty in California


California Job Tracker: State Makes Further Strides in Labor Market
Guest Column: Productivity Growth Slowdown and Income Distribution

Guest Column: Productivity Growth Slowdown and Income Distribution
By Gerd-Ulf Krueger
Productivity growth has become a hot topic lately among prominent economists and is mentioned in recent articles of The New York Times and The Atlantic. Measured as output per hour or per worker, productivity is the key driver of the nation�s standard of living.
Recent statistics show a slowdown in U.S. productivity growth and most of its components since 2007 (Figure 1). Between 2007 and 2015 U.S. productivity growth slowed down to 1.2% from 2.6% between 2000 and 2007. Some of this slowdown is cyclical but even taking this into account the recent productivity slowdown does not go away. Particularly vexing is the decline in the portion of productivity growth, which measures how smartly capital and labor is used, i.e. the level of managerial and labor skills.
Figure 1: It's Productivity ...
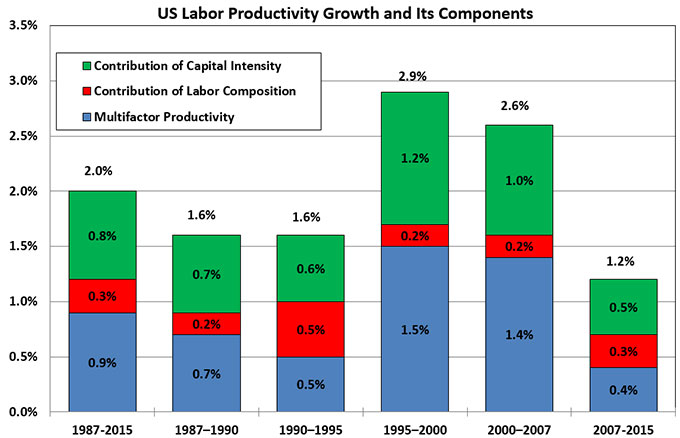
Source: U.S. Bureau of Labor Statistics
California productivity growth (nonfarm output per worker) echoes the national statistics. Between 2007 and 2015, California labor productivity growth slowed to 0.9% from 2.1% between 2000 and 2007 (Figure 2). This is worrisome since productivity growth is a fundamental measure of how smart and quick people work in services and manufacturing. In the long run, it is the ultimate growth engine that determines standards of living and the ability of the community to fulfill its obligations such as pensions.
Figure 2: California Productivity Growth Echoes National Slow Down
Average Annual Growth Rates (Private Nonfarm Output Per Worker)
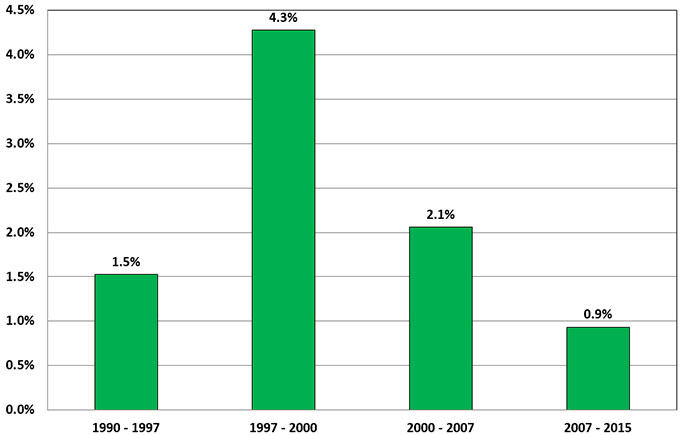
Sources: U.S. Bureau of Economic Analysis (BEA), U.S. Bureau of Labor Statistics (BLS), Krueger Economics
Although there is some skepticism about the accuracy of the productivity data, more and more economists take the productivity slowdown seriously, albeit with the hope that it might pick up later as new technologies make their way into market-driven activities. This happened in the 1995 to 2007 period once people figured out how to efficiently apply computer networks and new technologies - like scanners - to productive activities.
In addition, the Organization for Economic Co-operation and Development (OECD) recently added an interesting link between productivity and income distribution issues. They have found that there is an increasing gap in the difference of wages among firms, which might be related to a widening gap of productivity growth across those firms. In this context, global technology leaders saw average annual productivity increases of 3.5% in the manufacturing sector in the 2000s. In contrast, mid-sized firms experienced just 0.3%. In the service sector, the data shows similar results. The pace with which innovation spreads from the top-tier to lesser firms looks to be slowing, which may be a contributing factor to the worsening income distribution. There also are hints that business dynamism as measured by startup rates and the pace with which new firms replace unproductive older firms has slowed down. Figure 3 shows how in California the entry rate of new firms declined in the 2009 to 2011 period compared to the 1978 to 1980 period; although, this might be due to the lingering effects of the Great Recession. However, if this continues as more recent data comes in, it also could affect the broadening of advanced technologies and skills in California.
Figure 3: Loss in California Business Dynamic
| Entry Rate | Exit Rate | Job Reallocation Rate | |||||||
|---|---|---|---|---|---|---|---|---|---|
| State and Metro Area | 1978-1980 | 2009-2011 | % Change | 1978-1980 | 2009-2011 | % Change | 1978-1980 | 2009-2011 | % Change |
| California | 17.1% | 8.6% | -49.8% | 11.0% | 10.0% | -8.9% | 40.0% | 29.0% | -27.6% |
| Los Angeles - Orange County | 15.9% | 8.8% | -44.8% | 10.7% | 9.9% | -7.8% | 39.0% | 29.5% | -24.4% |
| Inland Empire | 18.4% | 9.4% | -49.2% | 11.3% | 11.4% | 1.4% | 41.2% | 30.3% | -26.5% |
| Sacramento | 18.2% | 8.5% | -53.2% | 10.9% | 10.3% | -5.5% | 41.1% | 27.7% | -32.4% |
| San Diego | 19.1% | 9.2% | -52.0% | 11.6% | 10.1% | -13.0% | 41.3% | 28.1% | -32.1% |
| San Francisco - Oakland | 14.8% | 7.8% | -47.3% | 9.7% | 8.7% | -10.1% | 37.6% | 27.3% | -27.5% |
| Silicon Valley | 17.2% | 8.3% | -51.8% | 10.7% | 9.0% | -15.5% | 37.3% | 29.0% | -22.4% |
| Fresno | 15.5% | 6.8% | -56.4% | 9.7% | 8.7% | -9.7% | 42.0% | 29.7% | -29.4% |
Source: The Brookings Institutions
Related to this is the development of human capital on which productivity growth depends. There is clearly an effect of inequality on individuals� opportunities in terms of education and training, health, and access to higher level jobs or technologies, especially for low-income families. This undermines productivity diffusion and overall productivity.
So what about policies? The prime directive should be to jump start technology and skill diffusion from advanced companies to other firms. A big step in the right direction might be to ensure a level playing field between new firms and strong incumbent firms.
For example, startups are systematically more exposed to policies and regulations than larger companies, which can often unintentionally serve as barriers to entry. GoBiz, California ’s economic development arm, recommends that small businesses check regularly nine state agencies. As a minimum measure, the state should look if this can be consolidated into one access point.
California policy makers also may re-examine the myriad of training programs, tax incentives, and business loan incentive programs currently on its books and contemplate if they can be re-purposed to better foster the spreading of skills and technologies to smaller or non-frontier firms (a firm below those companies ranked in the top 5% of productivity growth). The current hodgepodge of training subsidies, tax incentives, and business loan incentive programs, often ends up flowing to big business and multi-national corporations
A sensible goal would be to broaden the access to a full entrepreneurial infrastructure of underprivileged communities and ethnic groups. In this context, it might be worthwhile to mirror the spirit of some national legislative initiatives by Congresswoman Maxine Waters on the state level. Particularly, her Fix Crowdfunding Act (H.R. 4855) and Supporting America’s Innovators Act (H.R. 4854), which are explicitly aimed at smaller local businesses and their growth, are steps in the right direction. Other inclusionary productivity enhancing ideas could be productivity and innovation credits for non-frontier firms providing tax benefits or cash payouts for training, IT investment, automation, intellectual property and R&D.
Since GoBiz is interested in big and small firms, it should also try to systematically link smaller firms with large firms and education providers to create a new type of network that spreads throughout the economy.
Gerd-Ulf Krueger, a member of Treasurer John Chiang’s Council of Economic Advisors, is principal economist and founder of KruegerEconomics, a housing and economic advisory firm for institutional investors, developers, builders, and state and local governments. The opinions in this article are presented in the spirit of spurring discussion and reflect those of the author and not necessarily the Treasurer, his office or the State of California.