Vol. 1, No. 4, Published August 6, 2015
Latest News: Summary of Ratings and Borrowing Costs
State Has Made Significant Gains Toward Stabilizing Its Fiscal Health, But Much Work Remains

The State has done a lot well recently to improve its fiscal health. These moves have led to improved bond ratings, thereby saving taxpayers money when the government borrows to pay for much-needed infrastructure and services.
The results are very real: California has experienced four ratings upgrades since fall of 2014. Seeking to improve ratings – which currently sit at Aa3 from Moody’s Investors Service, AA- from Standard & Poor’s Ratings Services (S&P) and A+ from Fitch Ratings -- is key as we seek to cut borrowing costs even more. Track our progress here.
Before we consider what we can do to boost ratings even more, it helps to look at what we�ve done right:
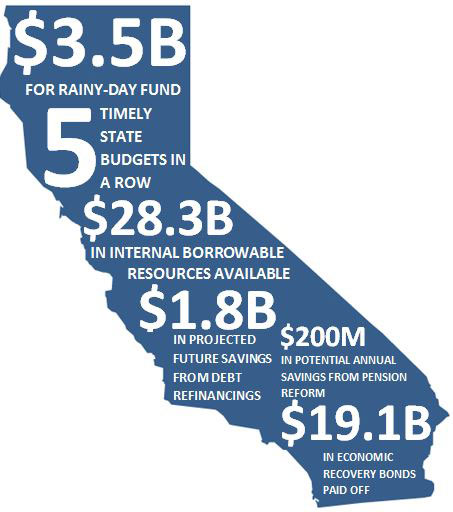
- For the first time in a generation, California has an improved rainy day fund based on both sound policy and an improving economy. Indeed, the Governor projects that the fund will have accumulated about $3.5 billion by the end of the 2015-16 fiscal year.1 This will help shore things up when the economy inevitably takes a downward turn.
- California has passed timely budgets in the past five years2, perhaps the strongest indication that the State�s policymakers and managers are well-aligned in their collective desire to work together to keep us on a sound financial footing. The Golden State is back and it�s on track.
- The State’s liquidity has improved sharply since the depths of the Great Recession. In the past year, the State’s internal borrowable resources had grown to $28.3 billion. 3 This is a point-in-time number and should be expected to fluctuate in the future.
- The State actively addressed an ailing pension system by enacting PEPRA, also known as the California Public Employees' Pension Reform Act of 2013. This created reforms that will produce meaningful results over longer periods of time, stabilizing a system that is an integral part of recruiting and retaining talented employees into public service. For example, the Legislative Analyst estimates that by 2020, State savings could top $200 million per year.4
- The State has effectively retired the final portion of $19.1 billion in Economic Recovery Bonds (ERBs), including principal and interest.5 These borrowings took place in the 2000s to close the State's operating budget deficit. Paying off the ERBs early will save taxpayers about $60 million, according to the Department of Finance.
- The State has also steadily chipped away at refinancing existing indebtedness at lower interest rates to take advantage of our improved ratings. Since the beginning of 2015, the Treasurer has completed six refinancings, which taken together account for a projected $1.8 billion in taxpayer savings over the long term.6
As we mentioned in the last edition of Intersections, the rating agencies measure three key areas before they assign a rating: 1) the state of our economy 2) the state of California’s finances and 3) management practices and responses to changing conditions. California’s economy has improved sharply since the Great Recession. By February 2014, California had recovered jobs lost during the downturn of 2008-09. Second, California’s finances have also improved, largely because of the better economy as well as fundamental and systemic changes implemented by the Legislature and the Administration. Finally, because of improved cooperation between the Legislative and Executive branches, California has greatly reduced its unhealthy reliance on budgetary borrowings, capitalization of deficits, and postponement of important support for vital programs, including public education. Taken together, all of these factors are producing favorable results. But, there is still much work to be done to deal with our aging infrastructure, addressing liabilities related to pensions and post-employment benefits, and making the investments necessary to ensure that California maintains its competitive position within the world economy.
In the September edition, we’ll discuss management practices we can adopt to help us further improve our bond ratings.
1 See page 5 of the Introduction of the enacted State budget.
2 The State budget takes effect on July 1 of each year. According to the Department of Finance, the Governor signed the 2015-16 budget on June 24, 2015; the 2014-15 budget on June 20, 2014; the 2013-14 budget on June 27, 2013; the 2012-13 budget on June 27, 2012; and the 2011-12 budget on June 30, 2011.
3 The amount available for internal borrowing from the State�s own funds was $28.3 billion as of June 30, according to the State Controller�s Office. That amount exceeded the May Revision estimate by $1.7 billion.
4 State savings related to pension reform could grow to more than $200 million per year, according to the Legislative Analyst�s Office.
5 See this State Treasurer�s Office news release for background.
6 Read more about debt issuance.
Where Does California Fit In?
Event after recent improvements, California�s bond ratings remain lower than all but two rated states: Illinois and New Jersey.
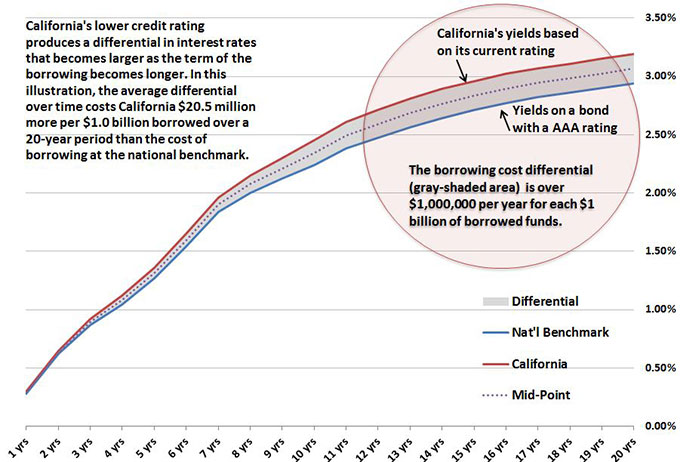
For California, holding the higher rating levels over time is what matters most. Lower ratings provoke investors to demand higher yields, which translates into higher borrowing costs.
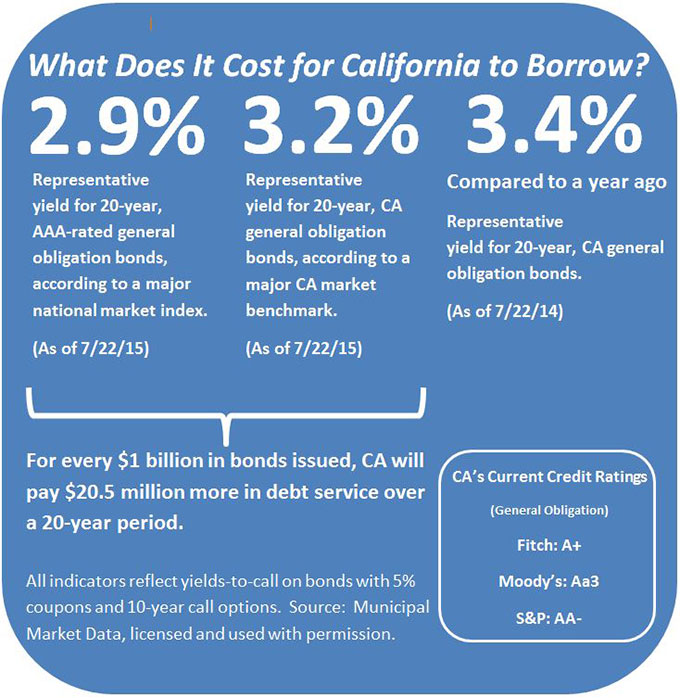
The State�s recent 20-year yield sat at 3.19 percent, higher than the 2.94 percent yield on a national benchmark of AAA-rated bonds, a difference of 0.25 percent. (See Figure 1.)
Compared to the prior month, the nominal yield on the California benchmark dropped by 0.13 percent, while the nominal yield on the national benchmark dipped by 0.08 percent.
The difference between the two benchmarks one year earlier was slightly wider: California�s yield was 3.40 percent, while that same national benchmark was at 3.01 percent, a difference of 0.39 percent.
Some of this narrowing is a direct result of the upgrade given to California’s credit rating by S&P in early July. The remainder is due to market forces.
Figure 1: Borrowing Costs
What does this mean for California taxpayers?
In general, for every $1 billion in bonds issued, the State will incur higher borrowing costs as a result of investors demanding investment yields. The result in such a scenario would be about $20.5 million in higher debt service over a 20-year period compared to the national benchmark of AAA-rated, tax-exempt bonds. (See Figure 2.). This compares to higher debt service of $24 million illustrated in last month's edition.
Slightly lower interest rates and California�s recent upgrade by S&P taken together would save the State $3.5 million over a 20-year period on a hypothetical borrowing versus the same data one month ago.
Figure 2: Comparing California's Borrowing Costs to a National Benchmark
Source: Municipal Market Data as of 7/22/15
When it comes to understanding why investment yields and borrowing costs behave this way, it helps to look at long-term trends.
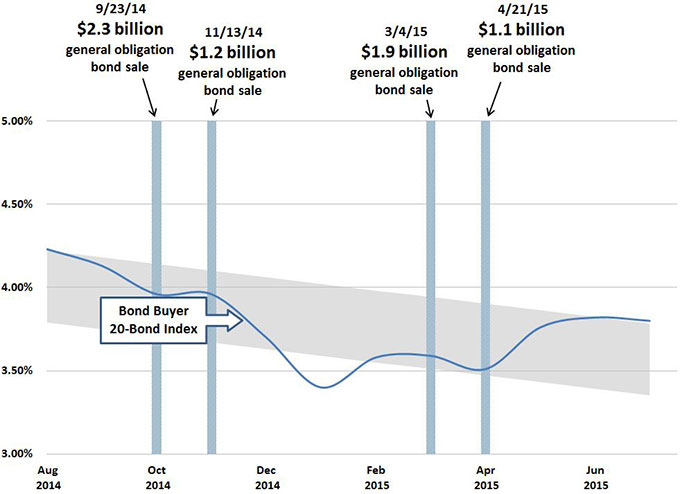
Figure 3, below, shows the one-year trend in another widely used index, the Bond Buyer 20-Bond Index, over the past year. California�s most recent offerings are shown as vertical bars.
The Bond Buyer 20-Bond Index has continued rising. This is most likely caused by media coverage of the fiscal stress in the City of Chicago, the debt crisis in the Commonwealth of Puerto Rico, and fears that the Federal Reserve System will raise interest rates sooner rather than later. In addition, national volume of new issues has picked up sharply and this produces a classic supply and demand imbalance.
Figure 3: One-Year Trend of Interest Rates, Selected California Borrowings Shown as Vertical Bars
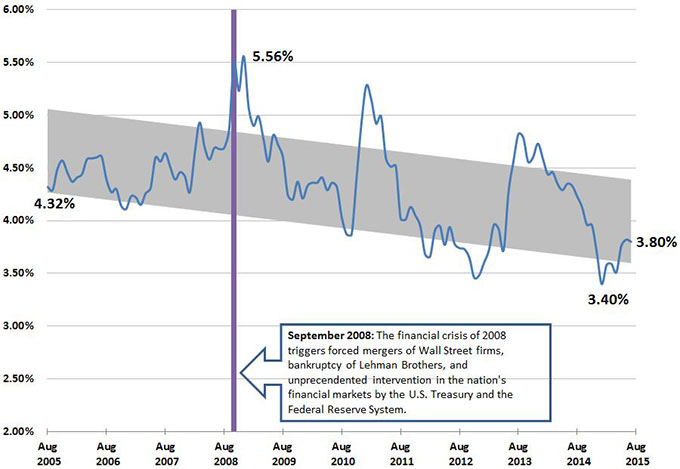
Interest rates on State and local government bonds are lower than they were a decade ago. Figure 4 also uses the Bond Buyer 20-Bond Index, but over a longer 10-year period.
After breaking out below the long-term trend earlier this year, this widely followed index is now moving back toward the trend line. This means that much of the recent movement is a reversion to that trend line rather than an unexplained spike in rates.
Figure 4: 10-Year Trend of Interest Rates on State and Local Government Bonds