
Vol. 1, No. 8, Published December 9, 2015
Debt Issuance, Investments and Treasury Activities
Debt Issuance

California state and local governments issued a total of $57.2 billion in debt during the first 10 months of 2015, a 10.7 percent increase from the same period in 2014, when $51.7 billion in debt was issued, according to data received by the California Debt and Investment Advisory Commission (CDIAC) as of November 23.2 (See Figure 5.)
A total of $2.8 billion in state and local debt issuance was reported for October 2015, a 98 percent decrease from October 2014 ($5.6 billion). (See Figure 6.)
Of the $2.8 billion issued in October, $1.7 billion was issued by local entities, while $1.1 million was issued by the State and its agencies or related entities. (See Figure 7.)
So far in 2015, the Treasurer has carried out four general obligation and two State Public Works Board bond re-financings that will together save the State’s General Fund $958 million over the life of the bonds. Nine other refinancings – including those for California State University, University of California and Tobacco Securitization Corp. -- will produce an additional $1.5 billion in public benefit over time. That brings the total to $2.5 billion in taxpayer benefits.
For the period from October 16 through November 15, a total of $4.5 billion in debt final sale reports were received by CDIAC. (See Figure 8.) These are the top five areas of volume within the reported final debt sales:
- K-12 School Facility: $933 million
- Public Building: $590 million
- Single-Family Housing: $446 million
- College, University Facility: $362 million
- Theatre/Arts/Museums: $341 million
2 Issuers have 21 days from sale of the debt to report issuances. Since some data is reported late, the State Treasurer's Office regularly updates monthly totals as more information becomes available.
Figure 5: Cumulative California Public Debt Issuance (In Billions)
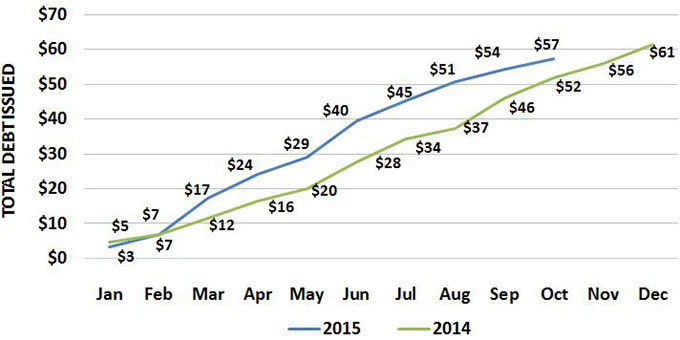
Source: California Debt and Investment Advisory Commission
Figure 6: California Public Debt Issuance, October (In Millions)
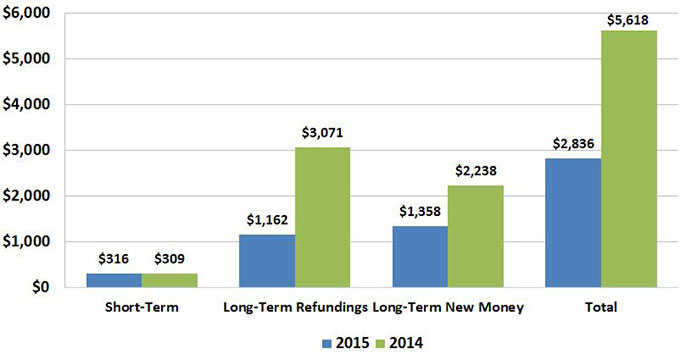
Source: California Debt and Investment Advisory Commission
Figure 7: State* Vs. Local Debt Issuance, October (In Millions)
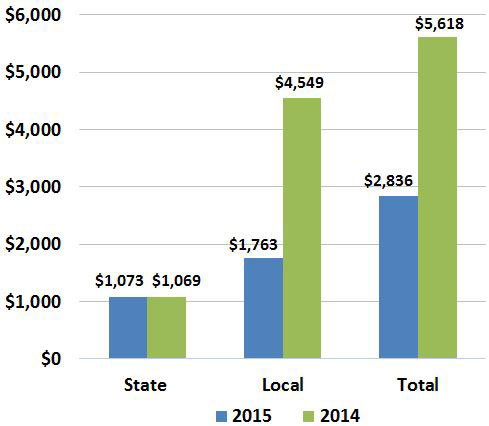
* State issuers include the State of California, its agencies, commissions, authorities, departments and The Student Loan Corporation.
Source: California Debt and Investment Advisory Commission
Figure 8: Total Reports of Final Sale Received
10/16/2015 Through 11/15/2015, By Purpose (In Millions)
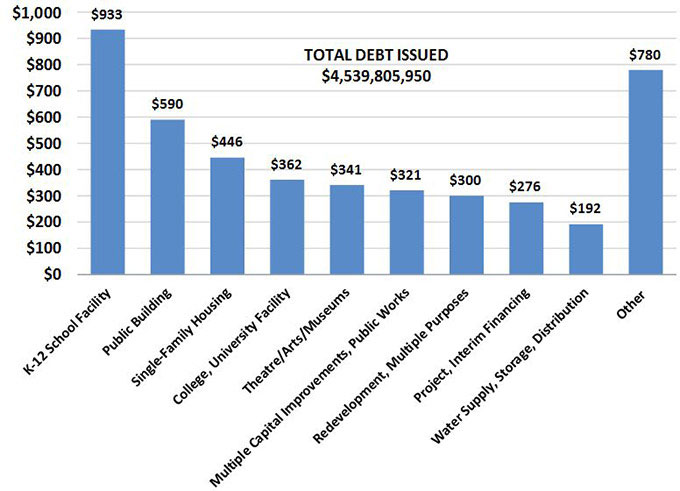
Source: California Debt and Investment Advisory Commission
Read more about debt issued so far this year. See the calendar.
Investments
The Treasurer’s Investments Division manages the State’s excess or idle cash.
The Treasurer invests taxpayer money through the Pooled Money Investment Account (PMIA). This is a commingled pool with three primary sources of funds: the State’s general fund, special funds held by State agencies, and money deposited by cities, counties and special districts in the Local Agency Investment Fund (LAIF).
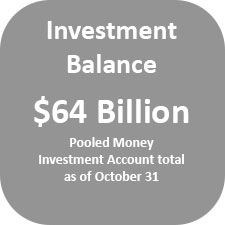
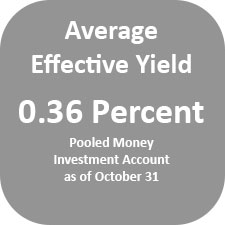
As of October 31, the PMIA balance was $64 billion, with an average effective yield of 0.36 percent and an average life of 200 days. (See Figure 9.) In addition, the year-to-date average PMIA balance was $65.7 billion.
The State Treasurer’s Office anticipates that the investment returns for the PMIA will continue to follow the market as shown in Figure 10.
Because these funds may be required on very short notice, the investment objectives for the PMIA are safety, liquidity and yield, in that order of importance.
The year-to-date earnings rate for the PMIA was 0.336 percent, which reflects the prudent investing of a short-term portfolio in this unprecedented low interest rate environment of the last seven years. As the Federal Reserve begins to raise interest rates, the PMIA is positioned to follow those moves, and overall yields should rise in sympathy.
Figure 9: Pooled Money Investment Account Stats as of October 31, 2015
Ending Portfolio
$64 billion (See Figure 11 for details.)
Average Workday Investment Activity
$1.037 billion
Average Effective Yield
0.36 percent
Average Investment Life
200 days
Local Agency Investment Fund Ending Portfolio
$19.7 billion (2,470 participating agencies) (See Figure 12 for details.)
Read more about the Pooled Money Investment Account
Figure 10: Average Monthly Yield Comparison
October 2010 Through October 2015
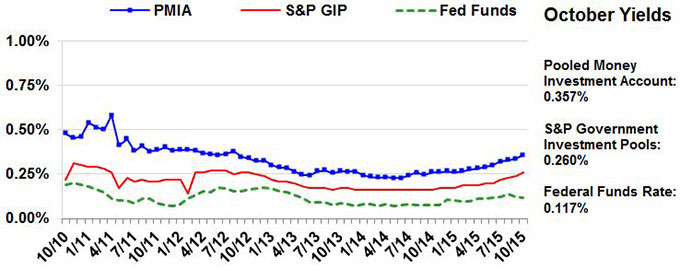
Source: State Treasurer's Office
Figure 11: PMIA Portfolio Composition � 10/31/15
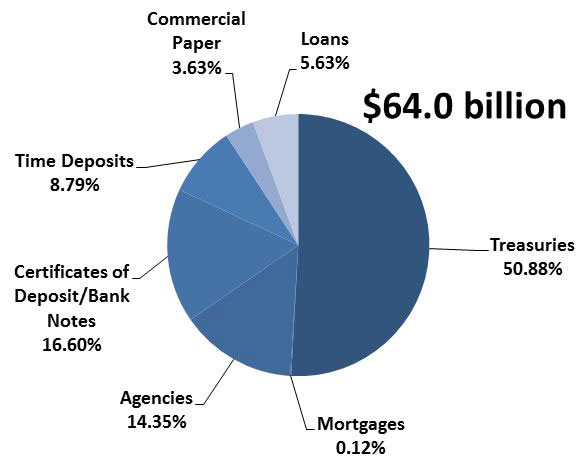
Source: State Treasurer's Office
Figure 12: Local Agency Investment Fund
Participation as of 10/31/15: 2,470 Agencies
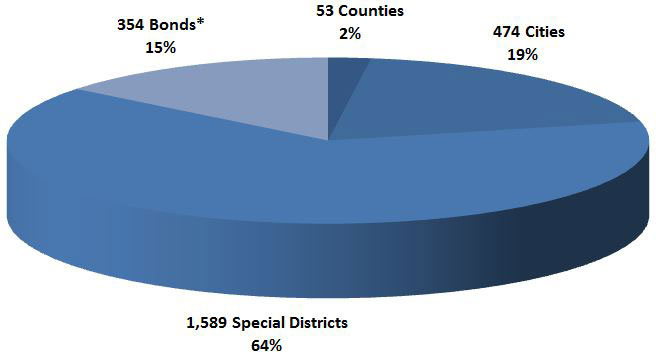
Source: State Treasurer's Office
*Includes regular and trustee bond accounts.
Note: Numbers may not add up to 100 percent due to rounding. Read more about the Local Agency Investment Fund.
Centralized State Treasury System Activities
The Treasurer’s Centralized State Treasury System provides banking services for the overwhelming majority of state departments and agencies.
The system handles the flow of more than $2 trillion per year in cash funds.
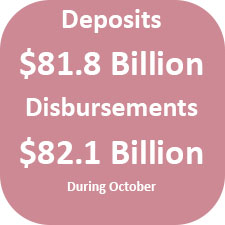
During October, deposits totaled $81.8 billion, while disbursements totaled $82.1 billion. (See Figure 13.)
These amounts include all federal, state and local funds flowing through the Centralized Treasury System.
Figure 13: Deposits and Withdrawals By Month, October 2014-October 2015 (In Billions)
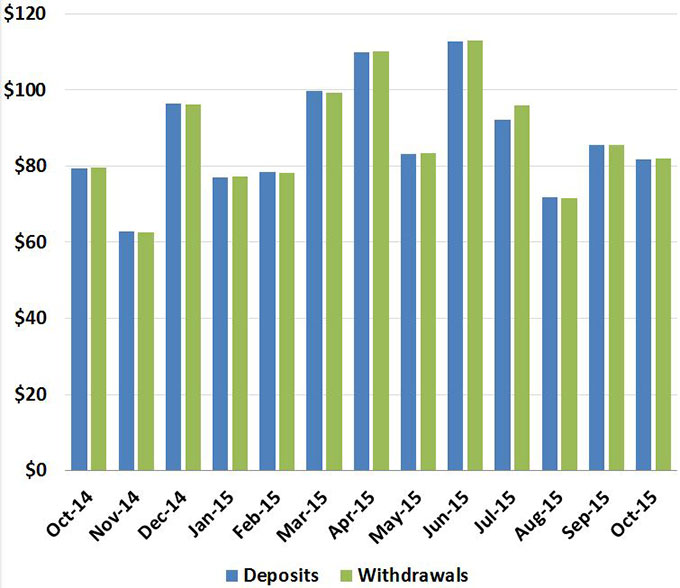
Source: State Treasurer's Office
The system also determines the amount of idle state funds available in the Pooled Money Investment Account for investment by the Treasurer’s Investment Division. (These investments were discussed in the Investments section and are reflected in Figure 11.)
During October, total new and rollover investments reached $8.5 billion. (See Figure 14.)
Figure 14: Total Investments By Month, October 2014-October 2015 (In Billions)
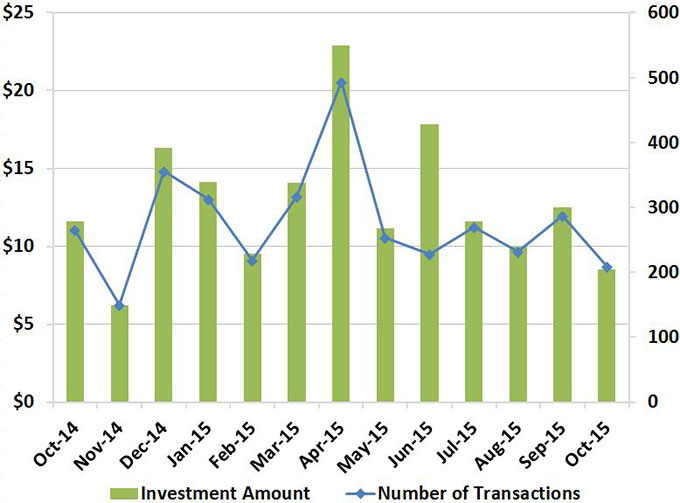
Source: State Treasurer's Office
Each day, the system also processes hundreds of thousands of state transactions - including department checks; State Controller’s Office warrants; Women, Infants, and Children (WIC) food instruments; and Employment Development Department unemployment and disability checks - submitted by banks and other entities for payment.
During October, total items processed reached 5.7 million. (See Figure 15.)
Figure 15: Number of Items Processed, October 2014-October 2015 (In Millions)
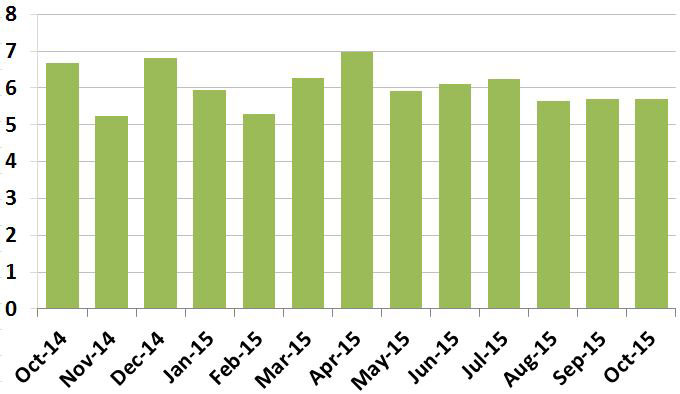
Source: State Treasurer's Office